
TABLE OF CONTENTS :
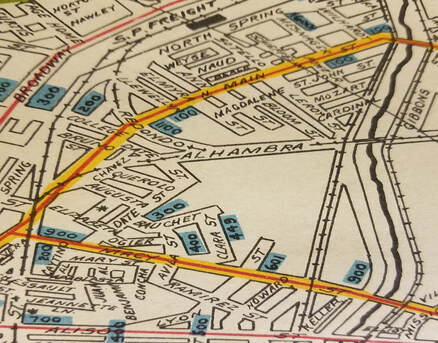
WAS MY LOS ANGELES NEIGHBORHOOD REDLINED? A Detailed Look at Los Angeles' 1939 HOLC Maps.6/30/2020 WAS MY LOS ANGELES NEIGHBORHOOD REDLINED? A Detailed Look at Los Angeles' 1939 HOLC Maps by Damian Gatto Always an enthusiast of United States Presidential history, I never quite understood why Franklin Roosevelt is remembered as such a progressive president. On top of his economic statism and the internment of 130,000 law-abiding citizens (127,000 Japanese and thousands of Italians and Germans) during his presidency, Roosevelt signed the National Housing Act of 1934 into law, which in-turn authorized the creation of the Federal Housing Administration. The FHA sponsored a private firm called the Homeowners' Loan Corporation (HOLC), charging them with the creation of a system that would guide the government in distributing aid to prevent foreclosures across the country. As a visual aid, the HOLC produced "residential security maps" indicating their assessment of real-estate stability in 239 U.S. cities, now referred to in the shorthand as "redlining maps" or "HOLC maps." The maps were overlaid with a four-color gradient indicating different levels of investment stability. From highest to lowest, these colors were: Green - "Best" Blue - "Desirable" Yellow - "In-Decline" Red - "Hazardous" One peculiar thing about the 1939 HOLC maps is that some of the criteria used to assess investment risks are fairly common in real estate, while other criteria are virulently racist, classist, and xenophobic. On the one hand, these color grades relied on some fairly typical real estate assessment criteria, such as: - Intrusion of industry or other noxious land uses, or proximity to those land uses - Mixed adjacent land uses, in general - Age of the community's housing stock - Rate of growth - Presence of multi-family housing of any amount, size, or kind (even a compact duplex) - Presence of nondescript architectural styles - Quality of construction - Availability and profusion of amenities (such as shops, transportation, attractions) - Availability or lack of infrastructure (such as sewers, electricity, hydrants) However, redlining maps are most discussed within modern social sciences disciplines for their use of race, class, religion, and country of origin as criteria for determining the security of real estate investments in many communities. In a country that was, at the time, largely biracial (at 89% White and 9% Black) and comprised of two or three disparate income categories, the consideration of race and class basically meant that a community's high percentages of Black and/or low-income residents were enough for the HOLC to assign a negative color grade. It is for these reasons that the HOLC are regarded as the pioneers of racial redlining. The term "redline" has also found its way into the vernacular more broadly to mean "set apart as hazardous or undesirable." In Los Angeles and other cities along the West Coast, HOLC contractors ran into a slight challenge. The HOLC contractors seemed to have only come expecting to assess "White-versus-Black" makeups of an area, being that the Area Description sheets only contained a line reading "Percentage Negro." However, cities like Los Angeles, San Fransisco, and New York were not so ethnically homogenous or dichotomous as many other places in the country. As such, the HOLC contractors wrote in many of the other ethnic and religious groups they encountered. Was MY Los Angeles Community Redlined? The short answer is, it is very likely that your Los Angeles County community was redlined (meaning that issuing loans in such a neighborhood was "hazardous") or given an assessment of yellow (meaning that the community was "definitely in decline"). The HOLC came through Los Angeles County and turned the cartography of the city into a Jackson Pollock mural. 22% of the city was redlined, 46% was yellowlined, 20% was bluelined, and 12% was greenlined. In other words, over two-thirds of the County of Los Angeles--68%, to be exact--was no bueno in the eyes of the HOLC. Redlined communities could even be found right next to greenlined ones--and in some places, the effects of these disparate assessments are still visible today. Below: Macro-level HOLC Residential Security Map of Los Angeles County, covering the Westside, Mid-City, Hollywood, South Central, East LA, Northeast LA, and some of the Gateway Cities. (Source: University of Richmond) 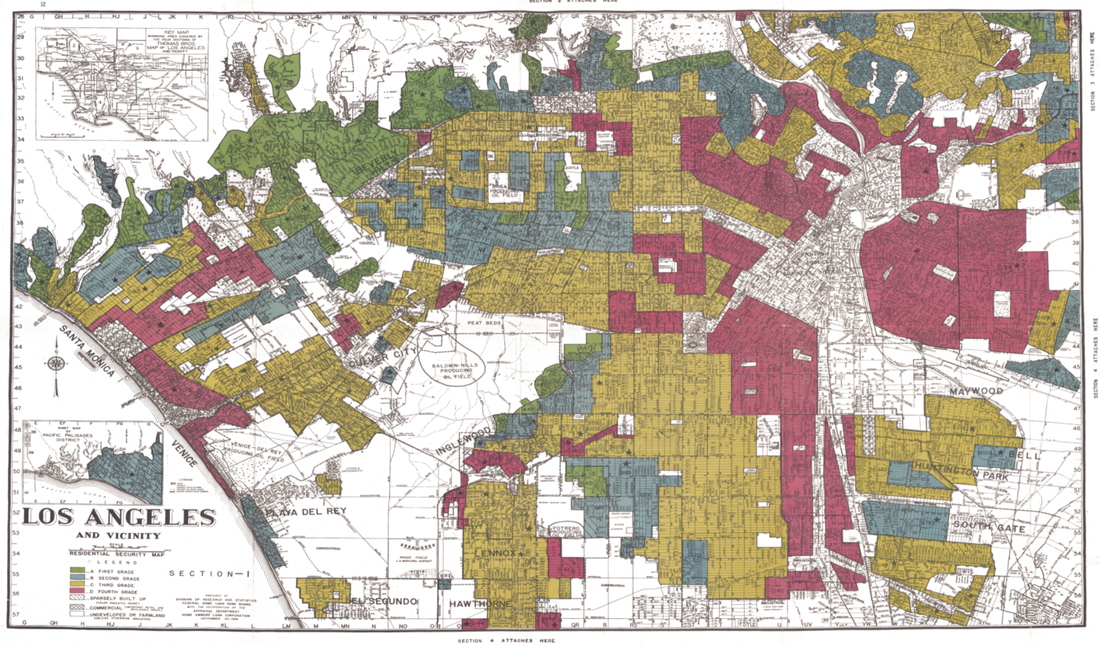 Most academic sources reproduce the raw map itself--which is great--but I decided to generate my own renditions of the HOLC maps, overlaid with current Los Angeles neighborhood boundaries. (Although there aren't official, administrative boundaries of LA 'hoods --just "agreed-upon" boundaries-- these imagined boundaries are what many Angelenos swear by and thus act as a more useful point of reference than the much more arbitrary lines drawn by the HOLC). Many published sources also fail to go into detail about geographic boundaries like streets or hills. Many sources also fail to mention the area description sheets attached to each area, listing the HOLC surveyor's "rationale" for their grades. I thus decided generate my own maps as a means to take a detailed look into how different communities in our city have been afflicted (or unscathed) by the 1939 HOLC map grades. I generated my renditions of the HOLC maps using the QGIS platform, and shapefiles for "Los Angeles Times Neighborhood Boundaries" and "1939 HOLC Redlining Areas" as my data. These are available via geohub.lacity.org and hub.arcgis.com . CLICK "READ MORE" BELOW
to turn the page and find out why your Los Angeles neighborhood was (or was not) redlined!
2 Comments
THE GREENEST BUILDING IS ONE THAT'S ALREADY THERE: The Enormous Potential For Adaptive Reuse in Los Angeles by Damian Gatto I. INTRODUCTION AND HISTORY Adaptive reuse is precisely what it sounds like: the adaptation and repurposing of a building (or other structure) for uses other than those for which it was originally designed. Adaptive reuse most commonly involves the rehabilitation of non-housing structures for use as housing, although some variation exists amongst the former and resultant uses of these structures. Los Angeles instituted its own adaptive reuse program in 1999 in the form of a zoning code amendment named the Adaptive Reuse Ordinance. The passage of the “ARO” followed a long series of events in the 20th century: the decline and destruction of neighborhoods in and around Downtown Los Angeles, the subsequent institution of eight Historic Protection Overlay Zones, and finally, very admirable early attempts by activists and investors like Ira Yellin, Tom Gilmore, Wayne Ratkovich, and others during the late 1970s to early 1990s to perform what would later be described as “adaptive reuse.”
During the late 20th century, Yellin (with the help of the Community Redevelopment Agency and the Metropolitan Transit Authority) successfully rehabilitated the Laughlin Building for residential use, as well as the Grand Central Market and Bradbury Building for commercial and governmental use. Gilmore was behind the restoration of many buildings in the Old Bank District. Ratkovich, for his part, spearheaded the beautiful restorations of the Oviatt Building, the Wiltern, and the Chapman Drive-in Market in Koreatown. In the midst of this, Los Angeles City Planner Alan Bell began writing the drafting the first versions of the Adaptive Reuse Ordinance in 1997-1998.
LAST STOP:
A Genealogy of the Naud Junction Neighborhood (Now Under the Terminal Annex and CA Endowment Buildings) INSIDE: LA's Early Immigrant Entrepreneurs ...and Their Erased Enclaves by Damian Gatto
Introduction A year and a half ago, I released my genealogy of the La Loma neighborhood of Chavez Ravine. My sample size was the neighborhood’s five remaining streets: Bouett, Brooks, Spruce, Aqua Pura, and Phoenix. My data sources were the United States Censuses from 1900 to 1940, historic building permits, land surveys, home titles, and grant deeds. I went lot-by-lot along the remaining La Loma streets documenting the builders and subsequent occupants of the homes until they were demolished. Media portrayals of Chavez Ravine during the era of its slow demise depicted the community as a ramshackle bunch of shanties and corrugated steel shacks. However, I knew based on my lifelong relationships with some of the uprooted (known as Los Desterados) that this was a vast misrepresentation. Indeed, I found that nearly every building in this five-street remnant of La Loma had a new construction permit attached to it. Another thing that fascinated me about communities like Chavez Ravine, Dogtown, Diamond Street (amongst many others) is how they were all selected to be razed and replaced with public (and sometimes private) improvements. In light of new documentation and testimonials, it is now no secret that these communities were perfectly healthy communities, but they simply had the misfortune of being built upon land that was too valuable for public and private use to be in the hands of working-class folk. The Naud Junction and Macy Street neighborhoods, which now lie, respectively, under the Terminal Annex and Union Station, were two of these such neighborhoods. This article focuses upon the Naud Junction Neighborhood, the Northern 8th Ward. The vast majority of homes were built before 1924 (when dozens were immolated, ostensibly to fend off the plague) or the mid-1930s (when they were eminent domained to build the the USPS Terminal Annex Building. When it comes to development and government improvement projects, it is easy to look to "blighted" areas (i.e. working class neighborhoods) and figure that they have to be improved upon. 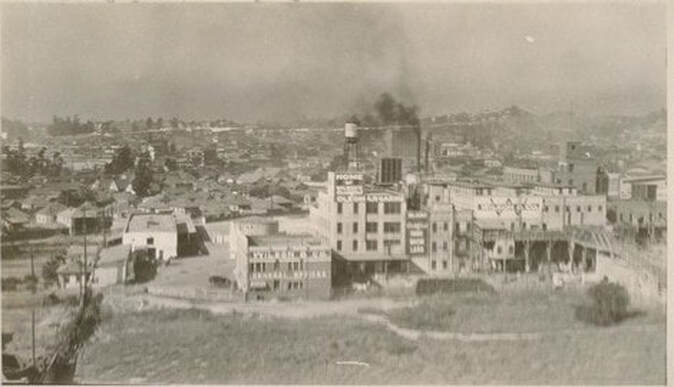
Above: The American Foundry. (Source: USC Digital Libraries)
The Naud Junction Neighborhood
From 1889 to 1909, prior to the establishment of the modern City Council representational system consisting of council districts, Los Angeles was divided into nine wards. The northern part of the Eighth Ward, which we will be strolling through today, was also called “Naud Junction” after Frenchman Edouard Naud, who built a warehouse near the modern-day William Mead Homes in 1878.
Naud Junction was marked by a signal tower built at Alameda and Ord streets in 1898. Naud Junction was also the location of the city of Los Angeles' primary boxing pavilion. USC students exchanged jabs there, and it also hosted the likes of Tommy Burns, Marvin Hart, and Abe Attel. The 8th Ward was also the site of the city's first orphanage, Institucion Caratitiva, as well as one of its most prominent infirmaries, the Los Angeles Infirmary. My motivation to do a genealogy of the Eighth Ward neighborhood was similar to Chavez Ravine. For one, I was interested in how the community was constituted demographically. I knew that the community was one of Los Angeles’ earliest melting pots. Persons of Mexican, Indigenous, Chinese, and Italian descent resided here, unable to find housing in other areas of the city due to “deed restrictions” (i.e. racial covenants) and other forms of discrimination. I was also aware of the neighborhoods role as a launching pad for numerous immigrant entrepreneurs, such as Gladding McBean & Co., the Italian-immigrant founded American Foundry, and the German immigrant-founded Kerckhoff Lumber Co. I had also heard of community institutions like the Macy Street School, designed by the famed architect A.C. Martin (of Los Angeles City Hall fame), which lasted all of 15 years before being demolished. A further motivation for performing this and other genealogies was that I wanted to further substantiate how, historically, working class communities in Los Angeles were the go-to communities that were razed in order to construct government buildings and other forms of urban redevelopment. Finally, following the illuminating results of my Chavez Ravine genealogy, I was inspired to document the daily life in the northern Eighth Ward--the community's geography, its goings-on, and its economic activity. I wanted the displaced villagers of Naud Junction to be known to future historians and Angelenos.
CLICK "READ MORE" BELOW for A Genealogy of the Eighth Ward
THE NATURE BOYS OF EDENDALE The Spiritualists, the Colburn Institute, the Landacres, and the Destruction of Urban Forests by Damian Gatto Originally published 24 April 2014 and updated mid-2017 INTRODUCTION In a city that is so built-up and is always trying to reinvent itself, it can be hard to recognize or appreciate the humble origins of many of its neighborhoods. At the turn of the 20th century, Edendale was something of a pastoral scene. As you stand at the northern terminus of Alvarado Street, looking north, you can almost see it. The Pacific Electric Red Car ran roughly where the 2 is. The hills of Silver Lake, Echo Park had only begun to exhibit little wooden bungalows. The Mediterranean landscape was mostly unspoiled by industry or development. The open roads were lined not with graffiti- covered soundwalls, but instead with Cedars and Live Oaks. 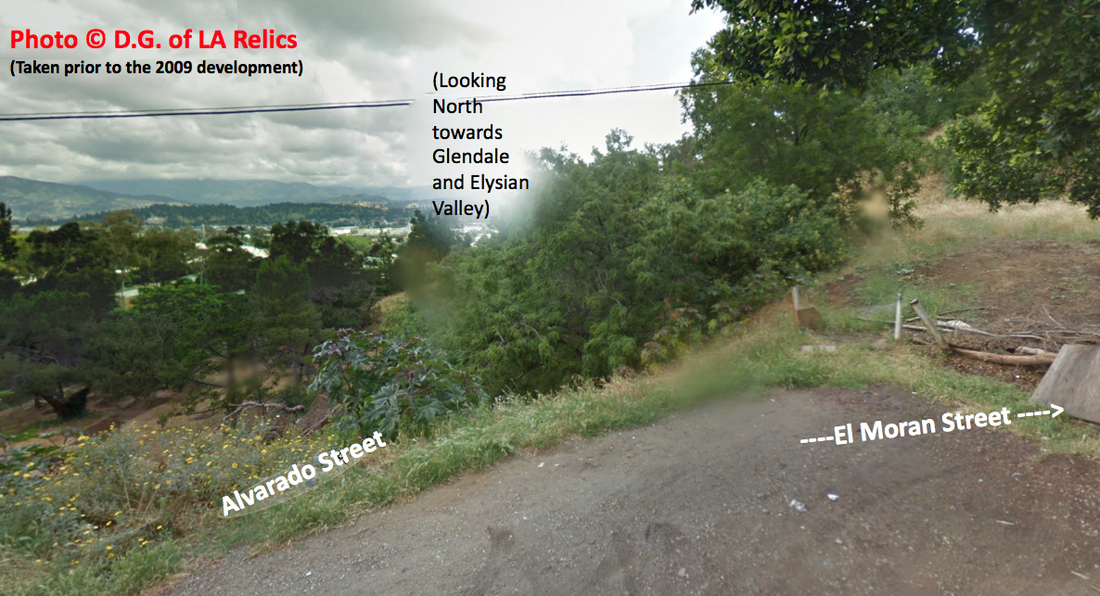 Above: A panorama taken by me of the Spiritualist Tract in 2009, before the Via Artis Development ravaged the whole hillside meadow. Below: The same vantage in the early 1900s. Notice the trolley tracks laid out. 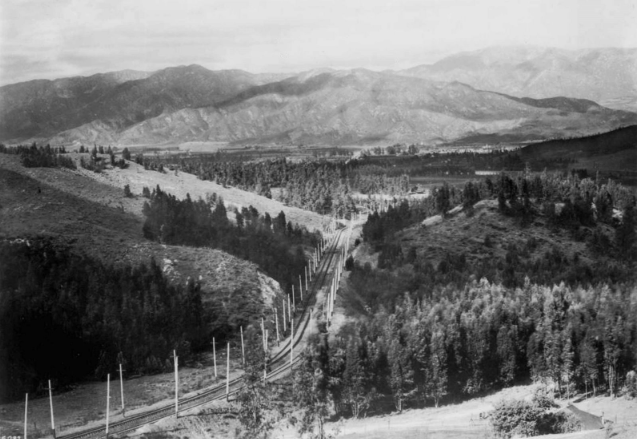 Los Angeles' most prolific period of growth occurred between 1880 to 1930. Neighborhoods like Lincoln Heights and Highland Park, just a few miles from Downtown, became some of the first “suburbs” of Los Angeles. As Los Angeles' population exploded by 10,970% during this five-decade period, there were Angelenos who sought to escape from this modernization and immense growth. While many came to Los Angeles for symptomatic relief from respiratory illness and flee the machine politics and density of the East Coast, others came to reside in the pseudo-agrarian landscape on the outskirts of the City.
This article is about the the Nature Boys of Edendale: the Semi-Tropic Spiritualists, the Colburn Institute, and the Landacres......and the destruction of their urban paradise. CLICK "READ MORE" BELOW |
Archives
December 2022
Categories
All
|
 RSS Feed
