
TABLE OF CONTENTS :
WAS MY LOS ANGELES NEIGHBORHOOD REDLINED? A Detailed Look at Los Angeles' 1939 HOLC Maps.6/30/2020 WAS MY LOS ANGELES NEIGHBORHOOD REDLINED? A Detailed Look at Los Angeles' 1939 HOLC Maps by Damian Gatto Always an enthusiast of United States Presidential history, I never quite understood why Franklin Roosevelt is remembered as such a progressive president. On top of his economic statism and the internment of 130,000 law-abiding citizens (127,000 Japanese and thousands of Italians and Germans) during his presidency, Roosevelt signed the National Housing Act of 1934 into law, which in-turn authorized the creation of the Federal Housing Administration. The FHA sponsored a private firm called the Homeowners' Loan Corporation (HOLC), charging them with the creation of a system that would guide the government in distributing aid to prevent foreclosures across the country. As a visual aid, the HOLC produced "residential security maps" indicating their assessment of real-estate stability in 239 U.S. cities, now referred to in the shorthand as "redlining maps" or "HOLC maps." The maps were overlaid with a four-color gradient indicating different levels of investment stability. From highest to lowest, these colors were: Green - "Best" Blue - "Desirable" Yellow - "In-Decline" Red - "Hazardous" One peculiar thing about the 1939 HOLC maps is that some of the criteria used to assess investment risks are fairly common in real estate, while other criteria are virulently racist, classist, and xenophobic. On the one hand, these color grades relied on some fairly typical real estate assessment criteria, such as: - Intrusion of industry or other noxious land uses, or proximity to those land uses - Mixed adjacent land uses, in general - Age of the community's housing stock - Rate of growth - Presence of multi-family housing of any amount, size, or kind (even a compact duplex) - Presence of nondescript architectural styles - Quality of construction - Availability and profusion of amenities (such as shops, transportation, attractions) - Availability or lack of infrastructure (such as sewers, electricity, hydrants) However, redlining maps are most discussed within modern social sciences disciplines for their use of race, class, religion, and country of origin as criteria for determining the security of real estate investments in many communities. In a country that was, at the time, largely biracial (at 89% White and 9% Black) and comprised of two or three disparate income categories, the consideration of race and class basically meant that a community's high percentages of Black and/or low-income residents were enough for the HOLC to assign a negative color grade. It is for these reasons that the HOLC are regarded as the pioneers of racial redlining. The term "redline" has also found its way into the vernacular more broadly to mean "set apart as hazardous or undesirable." In Los Angeles and other cities along the West Coast, HOLC contractors ran into a slight challenge. The HOLC contractors seemed to have only come expecting to assess "White-versus-Black" makeups of an area, being that the Area Description sheets only contained a line reading "Percentage Negro." However, cities like Los Angeles, San Fransisco, and New York were not so ethnically homogenous or dichotomous as many other places in the country. As such, the HOLC contractors wrote in many of the other ethnic and religious groups they encountered. Was MY Los Angeles Community Redlined? The short answer is, it is very likely that your Los Angeles County community was redlined (meaning that issuing loans in such a neighborhood was "hazardous") or given an assessment of yellow (meaning that the community was "definitely in decline"). The HOLC came through Los Angeles County and turned the cartography of the city into a Jackson Pollock mural. 22% of the city was redlined, 46% was yellowlined, 20% was bluelined, and 12% was greenlined. In other words, over two-thirds of the County of Los Angeles--68%, to be exact--was no bueno in the eyes of the HOLC. Redlined communities could even be found right next to greenlined ones--and in some places, the effects of these disparate assessments are still visible today. Below: Macro-level HOLC Residential Security Map of Los Angeles County, covering the Westside, Mid-City, Hollywood, South Central, East LA, Northeast LA, and some of the Gateway Cities. (Source: University of Richmond) 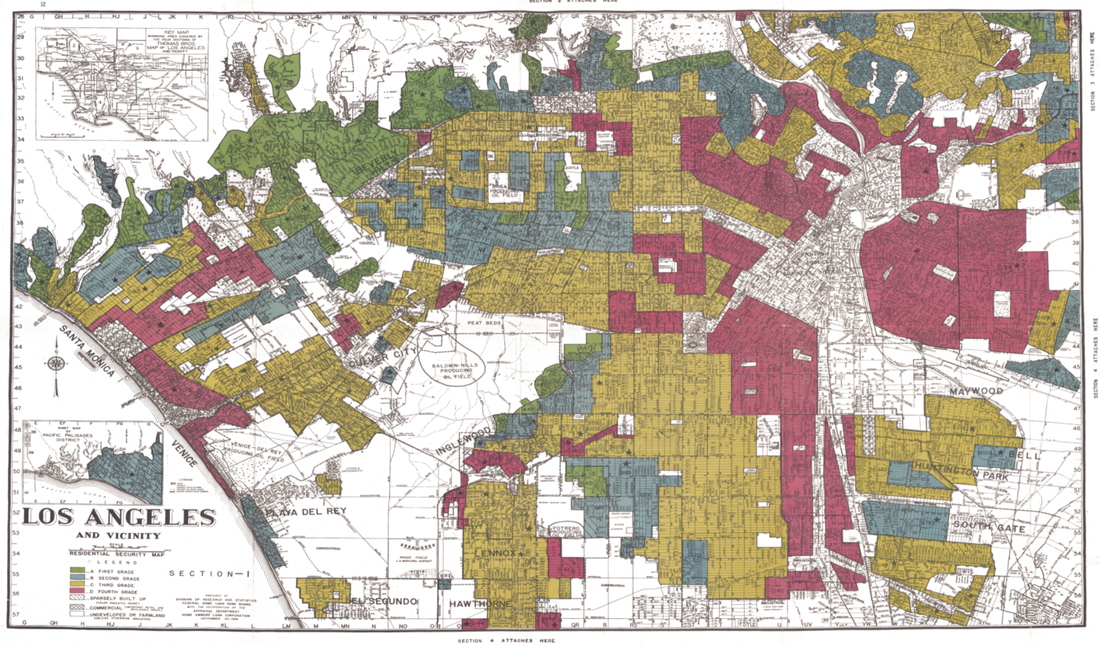 Most academic sources reproduce the raw map itself--which is great--but I decided to generate my own renditions of the HOLC maps, overlaid with current Los Angeles neighborhood boundaries. (Although there aren't official, administrative boundaries of LA 'hoods --just "agreed-upon" boundaries-- these imagined boundaries are what many Angelenos swear by and thus act as a more useful point of reference than the much more arbitrary lines drawn by the HOLC). Many published sources also fail to go into detail about geographic boundaries like streets or hills. Many sources also fail to mention the area description sheets attached to each area, listing the HOLC surveyor's "rationale" for their grades. I thus decided generate my own maps as a means to take a detailed look into how different communities in our city have been afflicted (or unscathed) by the 1939 HOLC map grades. I generated my renditions of the HOLC maps using the QGIS platform, and shapefiles for "Los Angeles Times Neighborhood Boundaries" and "1939 HOLC Redlining Areas" as my data. These are available via geohub.lacity.org and hub.arcgis.com . CLICK "READ MORE" BELOW
to turn the page and find out why your Los Angeles neighborhood was (or was not) redlined!
2 Comments
Announcing: My 2020 Preservation Efforts! by Damian Gatto Having spent many years restoring historic homes, many more immersed in the details of eclectic Southern California architecture, as well as a summer volunteering in the Office of Historic Resources, I eventually realized my calling when I was an undergraduate to research and preserve historic properties in a city that is known for reinventing itself.
In this article, I am pleased to announce my historic preservation endeavors for the year 2020. I have listed the entries in the order by which I plan to submit them to the Office of Historic Resources. I will upload the case files of each monument as I submit them to the Historic Resources Commission. UPDATE April 2021: With the onslaught of the COVID-19 pandemic, its effects upon (among many other things) the pace of government business, my culmination of graduate school, and my work schedule, my 2020 preservation efforts have been greatly slowed to where I have only been able to submit the nomination for the property on Boylston Street. On top of this, the Office of Historic Resources has changed their rules for nomination submittal to where it must be done in-person and through appointment. I suspect this is their way of pacing down the sheer number of nominations that they receive in a given period of time. I will keep you all updated with new developments as they occur. CLICK "READ MORE" BELOW THE PHILOSOPHER ON ALLESANDRO STREET: A Tome of Letters and Other Writings by Edendale Nature Boy Dr. Edgar Colburn Found Buried in a Santa Clarita Bookstore !!! by Damian Gatto INTRODUCTION You may have read my piece from October 2017 (originally written in 2014) entitled The Nature Boys of Edendale about the Semi-Tropic Spiritualists, the Landacres, and the Colburn Biological Institute, all of whom resided on a tract located southeast of Allesandro Street in the late 19th and/or early 20th centuries. Landacre came to Southern California from his native Ohio to rehabilitate himself from a respiratory illness (as did many others at that time), and thereafter realized his passion for wood engraving and printmaking. The Spiritualists and Colburn came to the West Coast in the late-19th century and early-20th century, respectively, with their alternative philosophies about the occult, astrology, and metascience. Colburn, for his part, was the pioneer of a field called "medicology." There had been a decent amount of information on the Landacres and the Spiritualists, but the Colburns--not so much. The Colburn Institute appeared on my radar via a blog comment by a longtime resident of Elysian Heights who recalled that, adjacent to the Semi Tropic Spiritualist Tract, there once stood “a house with a koi pond and a pitched roof” that “mysteriously burned down around 1979.” As it happened, I had a photograph documenting this to be true. 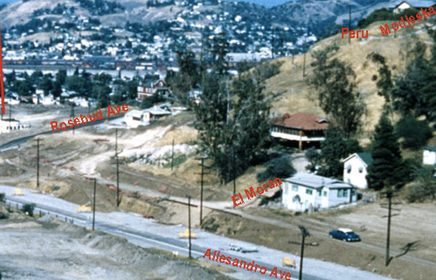 Above: A photo dating from the 1960s construction of the Allesandro Freeway, depicting a structure on stilts with a brown shake hipped roof, just to the right of center. This would be the hipped cottage spoken of in the aforementioned blog comment. (Source: Futterer family; the Holyland Exibition) CLICK "READ MORE" BELOW
THE EAST SIDE OF SOUTH CENTRAL (aka Historic South Central): A Brief History and Architectural Tour.6/30/2019 THE EAST SIDE OF SOUTH CENTRAL (aka Historic South Central) A Brief History and Architectural Tour by Damian Gatto
With its diverse socio-cultural history, architectural gems, and closely-knit communities, the East Side of South Central is one of Los Angeles’s oldest residential districts and one of its first suburbs. The district is bound roughly by Washington Boulevard (N), the City of Vernon (E), Main Street (W) and Slauson Avenue (S). Central Avenue, the district’s namesake, runs prominently throughout South Central and all the way to Del Amo Boulevard in the City of Carson. Much of the future neighborhood was included in the City of Los Angeles' original 1781 imperial land grant, but it remained largely agricultural until the mid-late 19th century. Even then, residential development in the East Side of South Central predates the West Side of South Central by over three decades, commencing in earnest around the 1870s. The community's antiquity reflects in the historic architecture that appears throughout the district. 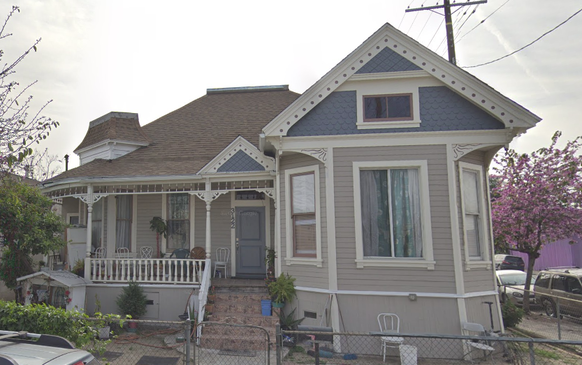 (Above: Some early residents of South Central, expatriates from Bunker Hill, sure brought their architectural sensibilities with them. This is a beautifully restored Queen Anne Victorian on 32nd and Maple, with Second Empire influences.) (Source: the author.)
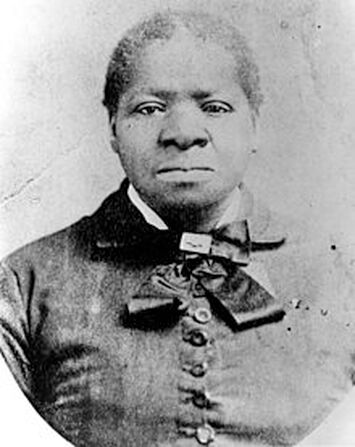
I. Early History and Biddy Mason This community, like relatively few other districts of Los Angeles of the time, contained a fascinating mix of people across race and class. The earliest residents included fire fighters and police officers, such as Officer Cecil S. Bowman, who resided at 1000 East 32nd Street and died in the line of duty on June 8th, 1911. Many early immigrant entrepreneurs purchased homes in the Central Avenue District, as it was first known. Peter Mayer, who was born in Colorado and ran one of the nation’s largest leather suppliers with his father, P. Mayer Leather Works, retired to Los Angeles in his old age, living on East 34th Street. Others commuted to Downtown on the Red Car trolley to work in factories or to help build the railroad. Still others were day workers who built homes for the more privileged, as my genealogies on Chavez Ravine, the Naud Junction neighborhood, and the Macy Street neighborhood have revealed. Even further still, early residents included Anglo residents who had originally lived in Bunker Hill, but in their old age had decided to retreat to early suburbs south of Downtown, such as South Park. However, the residents who would come to define the area's cultural history were descendants of freed African-Americans and their families. They initially moved into an enclave near Spring Street known as the "Brick Block" and congregated around the landholdings of a woman named Biddy Mason. A tremendously successful and charitable woman in her own right, Biddy Mason donated considerable sums of her living to charity, sheltered the poor, and risked her life to help fight smallpox, which took the life of her young daughter. For this, Biddy Mason is one of the most important pioneers of early Los Angeles. The early African-American community in Los Angeles history was thus solidified with this congregation around Mason’s landholdings, along with Mason’s founding of the First AME Church, which is still in existence. However, many also sought to escape the ill habits of certain downtown neighborhoods, particularly those east of Main Street, which had become home to flop houses and red light districts. As such, they moved directly south along the Central Avenue Corridor and started anew in this suburban neighborhood, the Central Avenue District. By the 1910s, the California Eagle was calling the Central Avenue District the “Black Belt” of Los Angeles. Immigrants from all over the world also arrived in South Central, chiefly from Japan and Italy. Now transitioning out of its days as a mostly-White suburb, the Central Avenue district became attractive to working-class immigrants because it proximity to (and yet isolation from) Downtown’s business districts, as well as its being served by the streetcar. Even more African-American residents arrived in the neighborhood in the early 1940s due to the promise of wartime manufacturing jobs and the decline of other cities and towns across the country. By now, the Central Avenue District, which had been redlined in the 1939 HOLC surveys, had become a decidedly low-income area of the city. Nevertheless, the neighborhood continued to prosper as a center of working-class creativity and entrepreneurialism for generations. With, first, the abolition of racially-restrictive housing covenants in 1947, and then with integration policy in the late 1960s, African-Americans moved into the West Side of South Central, as well as other districts around Los Angeles like Mid-City and Baldwin Hills. Beginning in the 1980s, Latinos began settling in the East Side of South Central in large numbers. It was a first-stop for many first-generation immigrants. Others relocated in an attempt to escape the violence of districts like MacArthur Park and Boyle Heights--only to find themselves in one of the most violent LAPD divisions, Newton Division. Shootin' Newton. In 1988, the neighborhood had more completed applications for immigration amnesty than any other in the nation. While South Central and Southeast LA County cities like Compton had once been the focal point of the nation's largest Black community, between the 1970 and 1990 Censuses, the black population of South Central declined by 32%. By the 2000 Census, the East Side of South Central (by then coined “Historic South Central”) was one of the top 20 Latino-predominant statistical areas in Los Angeles County. As of the 2010 Census, there are 19,474 people per square mile, one of the highest densities in both the City and the County. A quarter of households are headed by single mothers, also high for the City and County. The population is quite youthful; the average age is 23, and nearly half are under the age of 35. (Below: An 1899 vernacular cottage with containing the shell of what used to be a stable.) (Source: Google Street View) 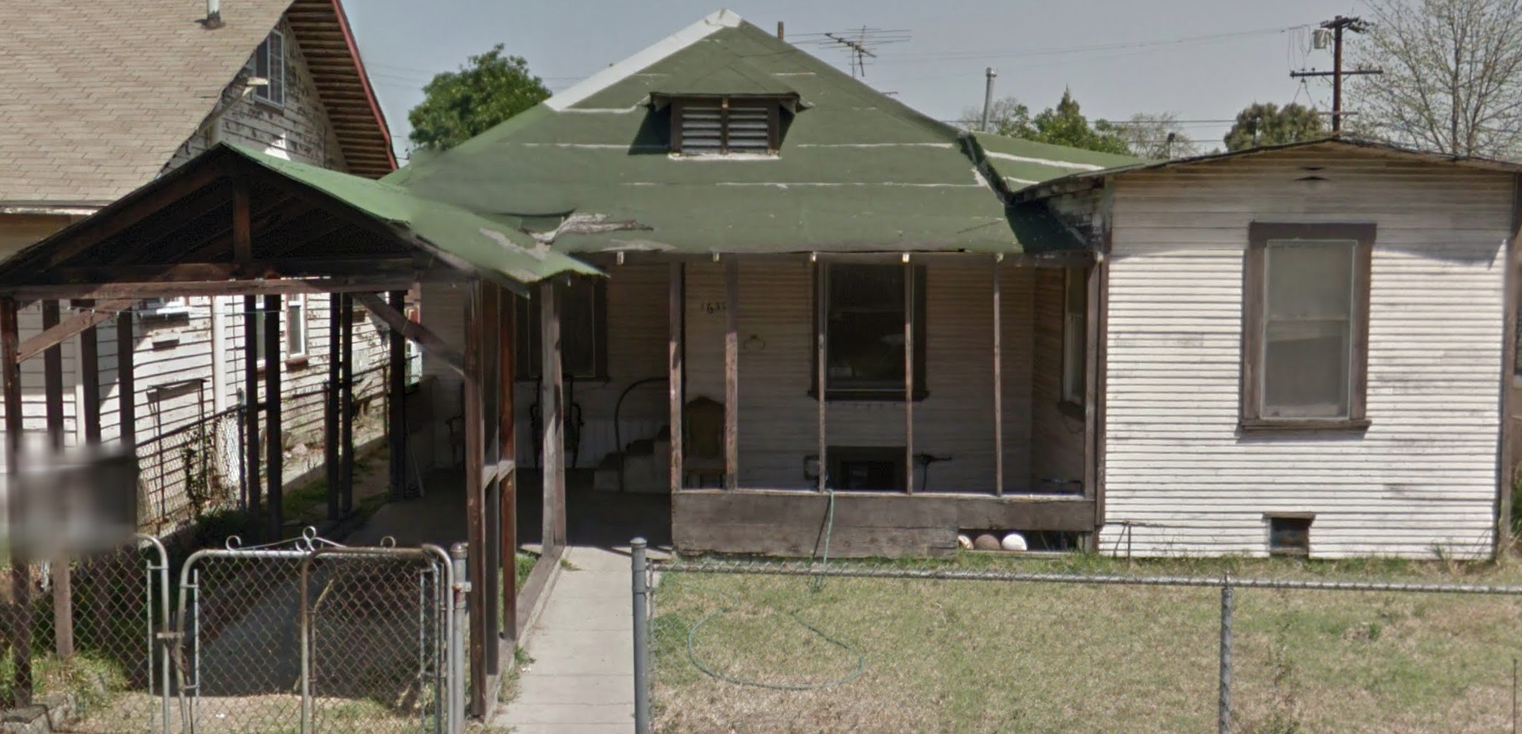 Today, the East Side of South Central remains a humble, working class community on Los Angeles' border with the industrial city of Vernon. The neighborhood’s historic, low-rise nature is reminiscent of how much of Los Angeles looked until the early-mid 20th century. Some residential blocks closer to Long Beach Boulevard and Alameda Street exhibit an obvious transition into industrial land use, depicted below. (Source: Google Street View) 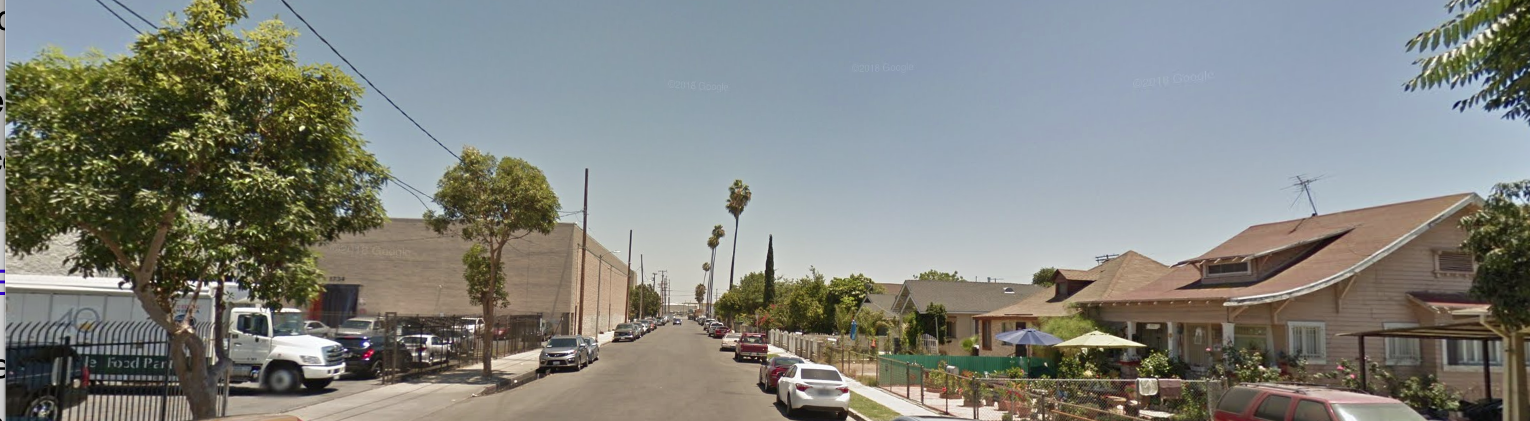 I got to know the community through a South Central heavy metal band I used to perform with, called Sector. The drummer lived on 43rd Street near Compton Avenue. The community reminds me a lot of where I grew up in Northeast LA. Homies work on their cars together. Little kids frolic in their front yards until sundown and then some. Street vendors stroll the block. Dozens of small family iglesias all project their versions of the gospel upon the street scene outside. The East Side of South Central has even retained different monikers for its different sub-sections. The northern part of the district is known as the "Low Bottoms," because of the smaller numbered streets that run through the area (e.g. 20th Street and 31st Street), while the southern portion along Long Beach Avenue is called "the Pueblos" after the Pueblo del Rio Housing Projects. The Central Avenue District.....South Central.....Historic South Central......the Low-Bottoms.......the Pueblos.....I love each of these names, as they illustrate the neighborhood from a variety of historical and socio-cultural standpoints. II. Residential Development Settlement and residential development in the East Side of South Central predates that of the West Side (e.g. Jefferson Park, Arlington Heights) by several decades—on some tracts, up to 40 years. This, in effect, makes the East Side of South Central the original South Central. There are some stunning examples of architecture in the East Side of South Central. Many specimens transcend the facadism of many tract homes around the City. It is astonishing more of the East Side of South Central does not have a historic protection overlay zone, aside from the recently-proposed 28th Street HPOZ. Granted, I’m not suggesting a sweeping HPOZ spanning the entirety of the neighborhood (since it is not the function of historic preservation to prevent any and all development. The fact is, there are plenty of architectural gems in the East Side of South Central that can and should be documented before development takes out many more of them. Let's check out some examples of residential and commercial architecture in the East Side of South Central. CLICK "READ MORE" BELOW
LAST STOP:
A Genealogy of the Naud Junction Neighborhood (Now Under the Terminal Annex and CA Endowment Buildings) INSIDE: LA's Early Immigrant Entrepreneurs ...and Their Erased Enclaves by Damian Gatto
Introduction A year and a half ago, I released my genealogy of the La Loma neighborhood of Chavez Ravine. My sample size was the neighborhood’s five remaining streets: Bouett, Brooks, Spruce, Aqua Pura, and Phoenix. My data sources were the United States Censuses from 1900 to 1940, historic building permits, land surveys, home titles, and grant deeds. I went lot-by-lot along the remaining La Loma streets documenting the builders and subsequent occupants of the homes until they were demolished. Media portrayals of Chavez Ravine during the era of its slow demise depicted the community as a ramshackle bunch of shanties and corrugated steel shacks. However, I knew based on my lifelong relationships with some of the uprooted (known as Los Desterados) that this was a vast misrepresentation. Indeed, I found that nearly every building in this five-street remnant of La Loma had a new construction permit attached to it. Another thing that fascinated me about communities like Chavez Ravine, Dogtown, Diamond Street (amongst many others) is how they were all selected to be razed and replaced with public (and sometimes private) improvements. In light of new documentation and testimonials, it is now no secret that these communities were perfectly healthy communities, but they simply had the misfortune of being built upon land that was too valuable for public and private use to be in the hands of working-class folk. The Naud Junction and Macy Street neighborhoods, which now lie, respectively, under the Terminal Annex and Union Station, were two of these such neighborhoods. This article focuses upon the Naud Junction Neighborhood, the Northern 8th Ward. The vast majority of homes were built before 1924 (when dozens were immolated, ostensibly to fend off the plague) or the mid-1930s (when they were eminent domained to build the the USPS Terminal Annex Building. When it comes to development and government improvement projects, it is easy to look to "blighted" areas (i.e. working class neighborhoods) and figure that they have to be improved upon. 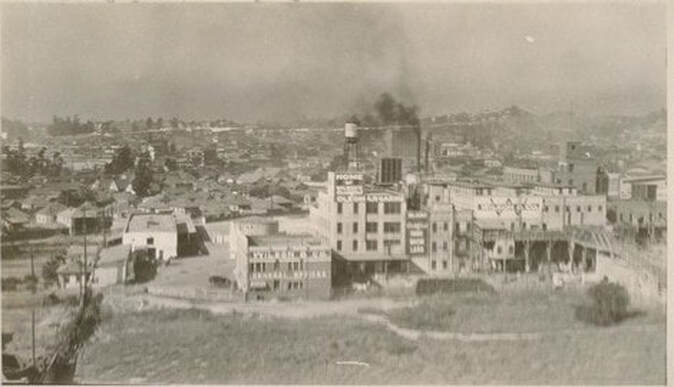
Above: The American Foundry. (Source: USC Digital Libraries)
The Naud Junction Neighborhood
From 1889 to 1909, prior to the establishment of the modern City Council representational system consisting of council districts, Los Angeles was divided into nine wards. The northern part of the Eighth Ward, which we will be strolling through today, was also called “Naud Junction” after Frenchman Edouard Naud, who built a warehouse near the modern-day William Mead Homes in 1878.
Naud Junction was marked by a signal tower built at Alameda and Ord streets in 1898. Naud Junction was also the location of the city of Los Angeles' primary boxing pavilion. USC students exchanged jabs there, and it also hosted the likes of Tommy Burns, Marvin Hart, and Abe Attel. The 8th Ward was also the site of the city's first orphanage, Institucion Caratitiva, as well as one of its most prominent infirmaries, the Los Angeles Infirmary. My motivation to do a genealogy of the Eighth Ward neighborhood was similar to Chavez Ravine. For one, I was interested in how the community was constituted demographically. I knew that the community was one of Los Angeles’ earliest melting pots. Persons of Mexican, Indigenous, Chinese, and Italian descent resided here, unable to find housing in other areas of the city due to “deed restrictions” (i.e. racial covenants) and other forms of discrimination. I was also aware of the neighborhoods role as a launching pad for numerous immigrant entrepreneurs, such as Gladding McBean & Co., the Italian-immigrant founded American Foundry, and the German immigrant-founded Kerckhoff Lumber Co. I had also heard of community institutions like the Macy Street School, designed by the famed architect A.C. Martin (of Los Angeles City Hall fame), which lasted all of 15 years before being demolished. A further motivation for performing this and other genealogies was that I wanted to further substantiate how, historically, working class communities in Los Angeles were the go-to communities that were razed in order to construct government buildings and other forms of urban redevelopment. Finally, following the illuminating results of my Chavez Ravine genealogy, I was inspired to document the daily life in the northern Eighth Ward--the community's geography, its goings-on, and its economic activity. I wanted the displaced villagers of Naud Junction to be known to future historians and Angelenos.
CLICK "READ MORE" BELOW for A Genealogy of the Eighth Ward
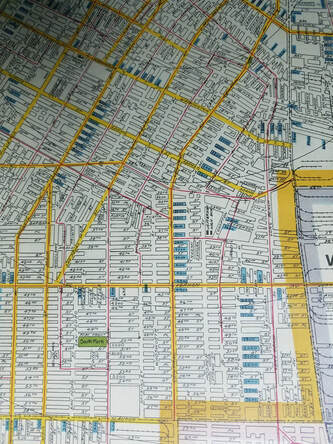
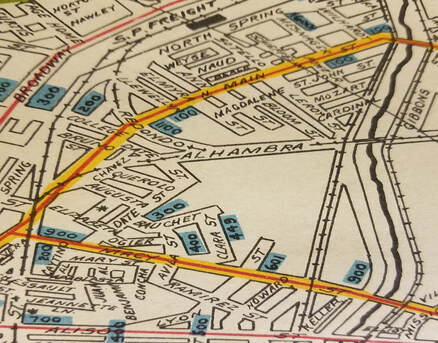
The Entirely Readable City: Notes on Los Angeles Cartography and Street Grid (s) by Damian Gatto 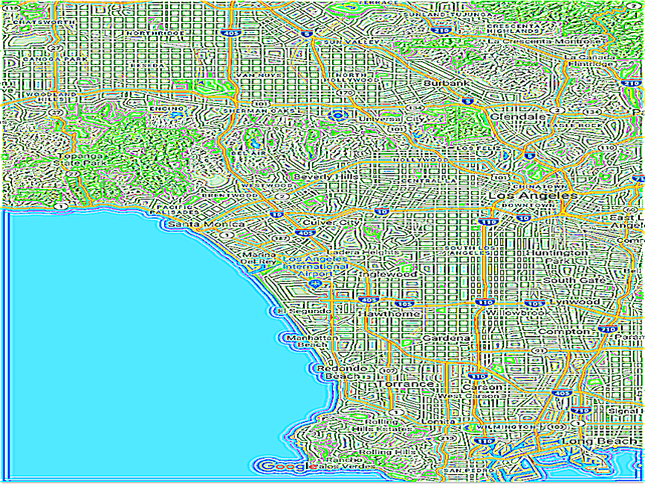 Source: Google Maps Whenever I tell people I studied urban planning and that I am passionate about effecting change in my home city, they usually politely smile and the conversation moves onward. If the conversation continues, I hear all of the (false) platitudes about LA’s urban design: how it consists of mindless, unplanned sprawl (false), or how it lacks a coherent address system (false), or how it lacks a perfect, contiguous waffle grid (okay, true), among other things. Author David C. Sloane does a great job disproving the characterization of LA’s sprawling nature as “mindless” throughout his brilliant book Planning Los Angeles. However, there remains the widespread idea that LA’s present state of design owes its design to poor planning processes. Recently, Christopher Hawthorne of the Los Angeles Times described a Los Angeles that is "hard-to-read. " While I can appreciate Hawthorne's extended anecdotes about growing up in a city he couldn't predict, and how all these other random irrelevant people have described Los Angeles' urban form as an "improvisation," I must objectively disagree with Hawthorne's interpretation of Los Angeles' urban landscape and street grid. ========================================================================== In response, this column is about the urban design of Los Angeles— specifically, the evolution of Los Angeles’ street grid and address system. ========================================================================== The fact is that Los Angeles’ street layout and address system is a product of the City’s evolution, numerous annexations, and the region's natural topography. During its first epoch--from 1781 to 1850-- Los Angeles was a humble pueblo, lacking any big plans for the future. The pueblo's boundaries and its street grid were a fraction of their current size. Beginning about two decades following California statehood, LA’s street layout was further altered as a result of various annexations, most of which occurred between the 1880s and 1930s, resulting in the distinct “clashing grid” that characterizes the City's urban design. Finally, there were erasures and re-drawings of small sections of the City throughout the 20th and early 21st centuries. Furthermore, the end of this article, there will be mention of how the Los Angeles region’s natural topography shaped the city’s urban design and layout. CLICK "READ MORE" BELOW
|
Archives
December 2022
Categories
All
|
 RSS Feed
