
TABLE OF CONTENTS :
WAS MY LOS ANGELES NEIGHBORHOOD REDLINED? A Detailed Look at Los Angeles' 1939 HOLC Maps.6/30/2020 WAS MY LOS ANGELES NEIGHBORHOOD REDLINED? A Detailed Look at Los Angeles' 1939 HOLC Maps by Damian Gatto Always an enthusiast of United States Presidential history, I never quite understood why Franklin Roosevelt is remembered as such a progressive president. On top of his economic statism and the internment of 130,000 law-abiding citizens (127,000 Japanese and thousands of Italians and Germans) during his presidency, Roosevelt signed the National Housing Act of 1934 into law, which in-turn authorized the creation of the Federal Housing Administration. The FHA sponsored a private firm called the Homeowners' Loan Corporation (HOLC), charging them with the creation of a system that would guide the government in distributing aid to prevent foreclosures across the country. As a visual aid, the HOLC produced "residential security maps" indicating their assessment of real-estate stability in 239 U.S. cities, now referred to in the shorthand as "redlining maps" or "HOLC maps." The maps were overlaid with a four-color gradient indicating different levels of investment stability. From highest to lowest, these colors were: Green - "Best" Blue - "Desirable" Yellow - "In-Decline" Red - "Hazardous" One peculiar thing about the 1939 HOLC maps is that some of the criteria used to assess investment risks are fairly common in real estate, while other criteria are virulently racist, classist, and xenophobic. On the one hand, these color grades relied on some fairly typical real estate assessment criteria, such as: - Intrusion of industry or other noxious land uses, or proximity to those land uses - Mixed adjacent land uses, in general - Age of the community's housing stock - Rate of growth - Presence of multi-family housing of any amount, size, or kind (even a compact duplex) - Presence of nondescript architectural styles - Quality of construction - Availability and profusion of amenities (such as shops, transportation, attractions) - Availability or lack of infrastructure (such as sewers, electricity, hydrants) However, redlining maps are most discussed within modern social sciences disciplines for their use of race, class, religion, and country of origin as criteria for determining the security of real estate investments in many communities. In a country that was, at the time, largely biracial (at 89% White and 9% Black) and comprised of two or three disparate income categories, the consideration of race and class basically meant that a community's high percentages of Black and/or low-income residents were enough for the HOLC to assign a negative color grade. It is for these reasons that the HOLC are regarded as the pioneers of racial redlining. The term "redline" has also found its way into the vernacular more broadly to mean "set apart as hazardous or undesirable." In Los Angeles and other cities along the West Coast, HOLC contractors ran into a slight challenge. The HOLC contractors seemed to have only come expecting to assess "White-versus-Black" makeups of an area, being that the Area Description sheets only contained a line reading "Percentage Negro." However, cities like Los Angeles, San Fransisco, and New York were not so ethnically homogenous or dichotomous as many other places in the country. As such, the HOLC contractors wrote in many of the other ethnic and religious groups they encountered. Was MY Los Angeles Community Redlined? The short answer is, it is very likely that your Los Angeles County community was redlined (meaning that issuing loans in such a neighborhood was "hazardous") or given an assessment of yellow (meaning that the community was "definitely in decline"). The HOLC came through Los Angeles County and turned the cartography of the city into a Jackson Pollock mural. 22% of the city was redlined, 46% was yellowlined, 20% was bluelined, and 12% was greenlined. In other words, over two-thirds of the County of Los Angeles--68%, to be exact--was no bueno in the eyes of the HOLC. Redlined communities could even be found right next to greenlined ones--and in some places, the effects of these disparate assessments are still visible today. Below: Macro-level HOLC Residential Security Map of Los Angeles County, covering the Westside, Mid-City, Hollywood, South Central, East LA, Northeast LA, and some of the Gateway Cities. (Source: University of Richmond) 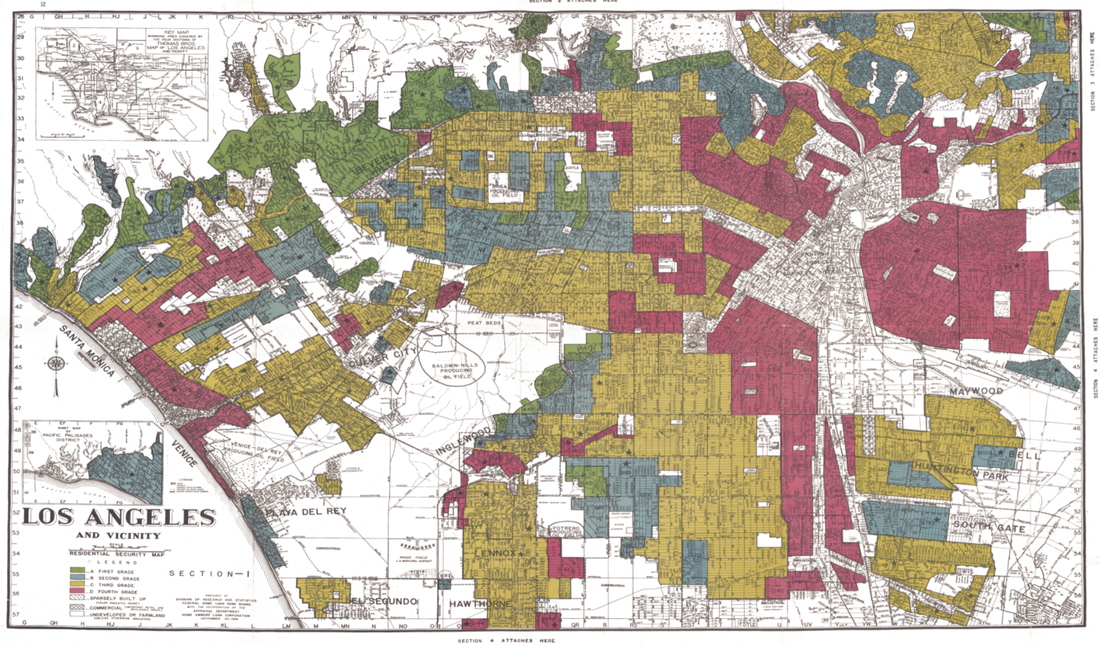 Most academic sources reproduce the raw map itself--which is great--but I decided to generate my own renditions of the HOLC maps, overlaid with current Los Angeles neighborhood boundaries. (Although there aren't official, administrative boundaries of LA 'hoods --just "agreed-upon" boundaries-- these imagined boundaries are what many Angelenos swear by and thus act as a more useful point of reference than the much more arbitrary lines drawn by the HOLC). Many published sources also fail to go into detail about geographic boundaries like streets or hills. Many sources also fail to mention the area description sheets attached to each area, listing the HOLC surveyor's "rationale" for their grades. I thus decided generate my own maps as a means to take a detailed look into how different communities in our city have been afflicted (or unscathed) by the 1939 HOLC map grades. I generated my renditions of the HOLC maps using the QGIS platform, and shapefiles for "Los Angeles Times Neighborhood Boundaries" and "1939 HOLC Redlining Areas" as my data. These are available via geohub.lacity.org and hub.arcgis.com . CLICK "READ MORE" BELOW
to turn the page and find out why your Los Angeles neighborhood was (or was not) redlined!
2 Comments
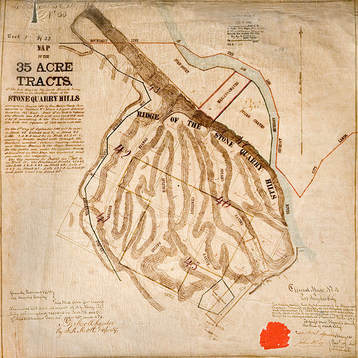
The Lasso of La Loma: A Genealogy of the Few Remaining Chavez Ravine Streets by Damian Gatto Chavez Ravine is the historic name for the hillside immediately northeast of Los Angeles’ Chinatown, and for the communities that once existed in these hills. For many, this land still is--and always will be--Chavez Ravine, the Lil' Town. I. The Lil’ Town City Councilman and namesake Julian Chavez acquired the land that would become Chavez Ravine, along with much of the land that would become Elysian Park, in the 1840s. The Stone Quarry Hills, as they were known then, was already populated with several ravine enclaves. By the late-19th/early-20th Century, “Chavez Ravine” was defined by four neighborhoods: Palo Verde, Bishop, La Loma, and Solano Canyon. Disdained as worthless land, and seen as too remote to make residential development pragmatic, it was initially the site of, among other things, a blasting mine. In 1926, LA City Council voted to zone Chavez Ravine for exclusively residential use.
Sadly, most people know about Chavez Ravine because of the way in which it met its demise, rather than its fascinating, unique, and diverse history. Originally, the communities of Chavez Ravine were razed through the power of eminent domain (the interpreted constitutional power of the government to seize land with "just" compensation) to make way for public housing designed by Richard Neutra. As the story goes, because of the anti-Communist political atmosphere of the time, this proposed “socialist” form of land use fell from favor. Following the infamous "helicopter ride," the land was purchased by the Dodgers, the final families were violently evicted, and Dodger Stadium was constructed in the early 1960s. Fewer than a dozen families remained by that time, most notably the Arechiga and Perich families, who were infamously documented being physically dragged from their home by LA County Sheriffs as news cameras rolled. Once a contiguous range of ridges, the construction of the Stadium and its giant parking lot were made possible by leveling the ridge lining the Bishop and Palo Verde neighborhoods and infilling the remaining gap with silt. Angelenos formed communities in Chavez Ravine for a century before Dodger Stadium came around. A truly sui generis community, its humble, owner-built bungalows and country markets contrasted with the bustle of Downtown, less than one linear mile away. A mostly Latino community by the early 20th century, it also had a considerable number of Slavic, Italian, Jewish, German, and Anglo residents. A remarkable mixture of people, mostly working class, flocked there not only to live the simpler life, but also to avoid housing discrimination in other sections of the City. Residents built their own homes and raised livestock. Children frolicked in its dirt roads. People looked out for each other. This idyllic, agrarian setting was almost too good to last forever in the rapidly modernizing City of Angels. II. The Physical Remains of Chavez Ravine When Dodger Stadium was built, only the Solano Canyon community was spared in its entirety. However, terraced above the 110 Freeway, south of the Stadium, are also the few remaining traces of the La Loma neighborhood: six streets from the neighborhood, lined with foundations of houses and-- if you look hard enough-- scattered belongings. Take the Academy Road exit off of the southbound 110 Freeway. Traveling northbound, Solano Avenue terminates at Bouett Street. Bouett, in turn, dead ends at a City-padlocked gate. Beyond this gate is Brooks Avenue, which travels southward up into the hills and merges with Spruce Street, coming to an end at the ovular Aqua Pura Drive. The arrangement forms a neat little lasso shape on a map. Below is a detail of Baist's survey (1910 and 1921), depicting the respective lot cuts and all. 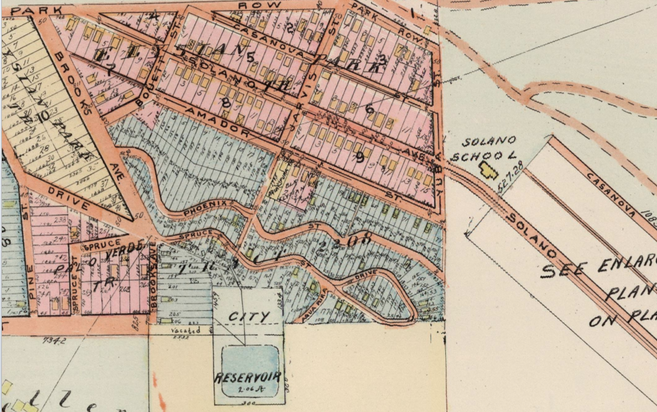 Above: Enlarged detail of the 1921 Baist survey depicting the lot cuts on our five sample streets: Bouetts, Brooks, Spruce, Aqua Pura, and Pheonix. Yolo Drive is also pictured. (Source: USC Digital Libraries) Immediately west of this lasso-shaped island, leading to the Chavez Ravine Reservoir, is a tiny stub of what used to be Yolo Drive. Parallel to Spruce Street (and right behind the San Conrado Church) was the serpentine Phoenix Street. Although Phoenix Street was formally designated, it was never paved, and as such has receded from view. At present, it is slowly being reclaimed by nature. You can hike up into the hills behind the church, along Phoenix Street, up until where it intersects with an old, unpaved portion of Jarvis Street. Here is where you will find poignant signs of former habitation, such as foundations of houses. You can see items that had just been in the kitchen…or in the family room…or on the porch… one day, 60-odd years ago. It is truly profound. It feels wrong to remove or even touch these things. III. A Genealogy of The Neighborhood Bouett Street, Brooks Avenue, Spruce Street, Aqua Pura Drive, and Pheonix Street. With this sample size--five streets, sans the stub of Yolo Drive, for now-- I decided to conduct a street genealogy in order to deduce the demography as well as some of the building habits of La Loma folks, to see if I could paint a picture of the geography of a Chavez Ravine neighborhood. Though it would be quite an undertaking to perform such a task for the entirety of Chavez Ravine, someday I may do just this. The following is a list of all the recorded house numbers on these streets, containing the names and families appearing on the original titles of the properties, their mailing addresses (if applicable), and whether they built the structure(s) themselves or hired a contractor-builder. If an original title was not available to deduce the name of the owner-builders, the names of the earliest known owners are listed instead. + Phoenix Street’s address system ran from 600 to 800. + Aqua Pura Drive’s address system ran from 600 to 700. + Spruce Drive’s address system ran from 500 to 800. + Brooks Avenue's address system ran from 1700 to 1900, and from 700 to 900. Much of the 1800 to 1900 block of Brooks (save for 1860) is still standing today, and as such is omitted below…for now. + Bouett Street's built environment still largely stands, and so a street genealogy is omitted...for now. CLICK "READ MORE" BELOW
|
Archives
December 2022
Categories
All
|

 RSS Feed
